The newest trend in basketball is the use of advanced statistics not only to evaluate teams but individual players as well. Player Efficiency Ratings strive to drill all the stats a player accumulates down to one number that represents their effect on the game and individual productivity. The amount of statistical information and ratings available on the NBA is mind boggling. If you visit the NBA Stats Glossary you can see all the available stats and ratings. As a coach, I have often utilized player efficiency ratings as a way to motivate and track a player's progress.
Back when I played in the NBA the EFF rating was used the most and often included on the box score. The NBA's Efficiency Rating is a single number measure of a player's overall contribution (both positive and negative) to a game he plays in. It is calculated as follows: (Points + Rebounds + Assists + Steals + Blocks) - ((Field Goals Att. - Field Goals Made) + (Free Throws Att. -Free Throws Made) + Turnovers). The biggest problem with the EFF rating is it does not factor in minutes played so therefore measures productivity but not really efficiency. Players who play more minutes are more than likely going to have a higher number. The positive to the EFF is that it is very easy to calculate.
The newest efficiency rating in the NBA is the Player Impact Estimate (PIE). PIE measures a player's overall statistical contribution against the total statistics in games they play in. PIE yields results which are comparable to other advanced statistics (e.g. PER which I discuss below) using the following formula: (PTS + FGM + FTM - FGA - FTA + DREB + (.5 * OREB) + AST + STL + (.5 * BLK) - PF - TO) / (GmPTS + GmFGM + GmFTM - GmFGA - GmFTA + GmDREB + (.5 * GmOREB) + GmAST + GmSTL + (.5 * GmBLK) - GmPF - GmTO). While I have never used PIE with any of my teams I do like that it creates a statistic relative to the game. Basically it is giving you a percentage showing how much of a positive or negative impact a player had on a game.
One of the simplest efficiency stats which is now shown on all NBA box scores is the +/-. The +/- stat looks at point differential when players are in and out of a game, demonstrating how teams perform with various combinations. While I like and use this statistic, I don't feel it truly represents a single player's impact on the game.
If you want to take player efficiency stats to an even more detailed analysis you can take a look at John Hollinger's PER on ESPN. The PER is an extremely complicated formula based on minutes played, pace and other factors. Due to how complicated it is, PER is not a stat coaches outside of the NBA and NCAA can use with their players because it's nearly impossible to calculate.
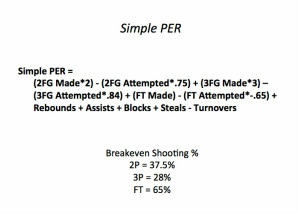
Because of this, I created a much simpler PER which I oddly enough named "Simple PER". Simple PER is calculated as follows: (2FG Made*2) - (2FG Attempted*.75) + (3FG Made*3) – (3FG Attempted*.84) + (FT Made) - (FT Attempted*-.65) + Rebounds + Assists + Blocks + Steals - Turnovers. Similar to PER, the Simple PER only gives positives for scoring if you shoot a decent percentage (see picture for breakeven shooting percentages). If a player scores a ton of points but shoots a very low percentage then they would not have a positive Simple PER. I chose a relatively low breakeven shooting percentage but that can be adjusted as needed. I like this formula because it is simple to calculate but factors in shooting percentages.
No player efficiency rating is perfect because it is practically impossible to drill down a player's impact into one number. However, these formulas and numbers if used consistently can be a great way to evaluate, motivate and educate players on the game and their impact on helping the team win.
Back when I played in the NBA the EFF rating was used the most and often included on the box score. The NBA's Efficiency Rating is a single number measure of a player's overall contribution (both positive and negative) to a game he plays in. It is calculated as follows: (Points + Rebounds + Assists + Steals + Blocks) - ((Field Goals Att. - Field Goals Made) + (Free Throws Att. -Free Throws Made) + Turnovers). The biggest problem with the EFF rating is it does not factor in minutes played so therefore measures productivity but not really efficiency. Players who play more minutes are more than likely going to have a higher number. The positive to the EFF is that it is very easy to calculate.
The newest efficiency rating in the NBA is the Player Impact Estimate (PIE). PIE measures a player's overall statistical contribution against the total statistics in games they play in. PIE yields results which are comparable to other advanced statistics (e.g. PER which I discuss below) using the following formula: (PTS + FGM + FTM - FGA - FTA + DREB + (.5 * OREB) + AST + STL + (.5 * BLK) - PF - TO) / (GmPTS + GmFGM + GmFTM - GmFGA - GmFTA + GmDREB + (.5 * GmOREB) + GmAST + GmSTL + (.5 * GmBLK) - GmPF - GmTO). While I have never used PIE with any of my teams I do like that it creates a statistic relative to the game. Basically it is giving you a percentage showing how much of a positive or negative impact a player had on a game.
One of the simplest efficiency stats which is now shown on all NBA box scores is the +/-. The +/- stat looks at point differential when players are in and out of a game, demonstrating how teams perform with various combinations. While I like and use this statistic, I don't feel it truly represents a single player's impact on the game.
If you want to take player efficiency stats to an even more detailed analysis you can take a look at John Hollinger's PER on ESPN. The PER is an extremely complicated formula based on minutes played, pace and other factors. Due to how complicated it is, PER is not a stat coaches outside of the NBA and NCAA can use with their players because it's nearly impossible to calculate.
Because of this, I created a much simpler PER which I oddly enough named "Simple PER". Simple PER is calculated as follows: (2FG Made*2) - (2FG Attempted*.75) + (3FG Made*3) – (3FG Attempted*.84) + (FT Made) - (FT Attempted*-.65) + Rebounds + Assists + Blocks + Steals - Turnovers. Similar to PER, the Simple PER only gives positives for scoring if you shoot a decent percentage (see picture for breakeven shooting percentages). If a player scores a ton of points but shoots a very low percentage then they would not have a positive Simple PER. I chose a relatively low breakeven shooting percentage but that can be adjusted as needed. I like this formula because it is simple to calculate but factors in shooting percentages.
No player efficiency rating is perfect because it is practically impossible to drill down a player's impact into one number. However, these formulas and numbers if used consistently can be a great way to evaluate, motivate and educate players on the game and their impact on helping the team win.
 RSS Feed
